| 1 | Fishing in a bigger pond – Despite the wide range of investment opportunities available in the US, a look beyond our borders can offer a much bigger playing field: There are nearly six times as many publicly traded international companies as there are US equities.1 |
| 2 | Which flavor do you prefer? – Developed-market equities invest in financially mature regions such as Europe and Japan, while emerging-market (EM) equities invest in developing countries and regions such as China and Africa. EM economies typically experience faster economic growth and have an added bonus of demographic tailwinds, which could potentially boost EM stocks, though they do come with increased risks. |
| 3 | Zagging when the US is zigging – While volatility is an inevitable part of investing, foreign markets don’t always rise and fall in sync with US markets. International investing can help smooth portfolio outcomes by introducing return patterns that differ from those of US equities. |
| 4 | Beyond the usual suspects – The 10 largest stocks in the S&P 500 Index now represent nearly 40% of the Index’s market value,2 giving a relatively small group of companies outsized influence on performance. International equities can help balance that influence by diversifying exposure across a wider range of companies, sectors, and regions. |
| 5 | A different piece of the pie – While the S&P 500 Index offers strong exposure to traditionally growth-oriented sectors such as technology and consumer discretionary, international equity markets tend to include a broader mix of industries, with greater representation in traditionally value-oriented sectors like financials, industrials, and materials. As a result, value-oriented stocks represent roughly 23% of the S&P 500 Index, vs. nearly 47% of the MSCI ACWI Index.3 |
| 6 | Missing the trees for the forest – Although US stocks have had a long run of strong performance, the majority of the world’s top-performing individual stocks have consistently been international. On average, 82% of the top-50 stocks globally were from non-US companies (FIGURE 1). |
| 7 | A patterned past? – Since the 1970s, US and international markets have often traded multi-year periods of outperformance. After nearly 15 years of US leadership, international stocks turned the tide in 2025—a recent reversal that may suggest market leadership is shifting once again.4 |
| 8 | The greenback impact – After remaining strong the last few years, the US dollar has generally been weakening. A weaker dollar tends to work in favor of international equities by making borrowing cheaper for foreign companies which, in turn, can help boost profits. |
| 9 | The more you know – Like all investments, international investing has its own set of risks. Investors may be subject to currency volatility, geopolitical disruptions, and liquidity risks that differ from investments here in the US. To help navigate these risks, it may be beneficial to access international stocks through professional active management. |
| 10 | Choose your own adventure – Investors can invest internationally by tracking a passive index, by using an actively managed fund that uses in-depth research, or through strategic-beta funds that use a rules-based methodology in an effort to outperform passive indices. |
FIGURE 1
The US Isn’t Always Best
Percentage of World’s Top-50 Stocks That Are Non-US
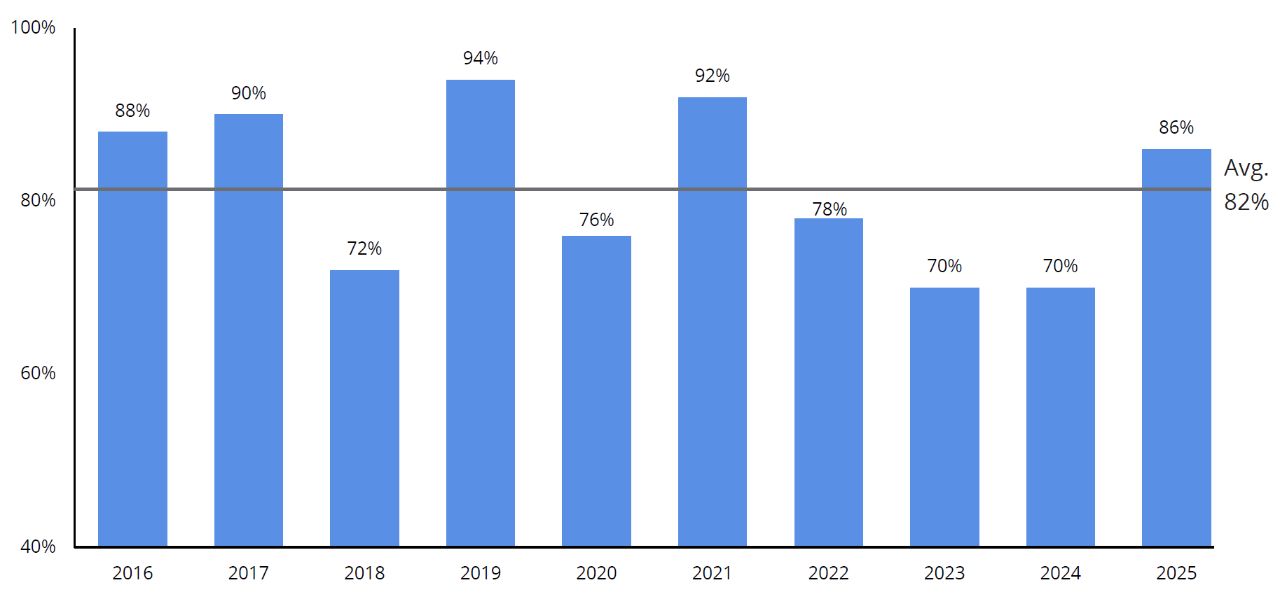
As of 12/31/25. Past performance does not guarantee future results. Investors cannot directly invest in indices. Based on the annual calendar-year returns of 50 highest-performing stocks of the MSCI ACWI Index. For illustrative purposes only. Source: FactSet, 2/26.
To learn more about international investing, talk to your financial professional.
1 As of 12/31/25. Data Source: Bloomberg, 2/26.
2 As of 12/31/25. Data Source: FactSet, 3/26.
3 As of 12/31/25. Data Source: FactSet, 3/26.
4 As of 12/31/25. Data Sources: Morningstar, Bloomberg, and Hartford Funds, 1/26.
MSCI ACWI Index is a free float-adjusted market capitalization index that measures equity market performance in the global developed and emerging markets, consisting of developed and emerging market country indices.
MSCI ACWI ex USA Index is a broad-based, unmanaged, market capitalization weighted, total return index that measures the performance of both developed and emerging stock markets, excluding the US MSCI index performance is shown net of dividend withholding tax.
S&P 500 Index is a market capitalization-weighted price index composed of 500 widely held common stocks.
Important Risks: Investing involves risk, including the possible loss of principal. • Foreign investments may be more volatile and less liquid than US investments and are subject to the risk of currency fluctuations and adverse political, economic and regulatory developments. These risks may be greater, and include additional risks, for investments in emerging markets. • Diversification doe snot ensure a profit or protect against a loss in declining market.
This material is not intended to be relied upon as a forecast, research, or investment advice, and is not a recommendation, offer, or solicitation to buy or sell any securities, or to adopt any investment strategy.