[an error occurred while processing this directive]
  • Products
  • Insights
  • Practice Management
  • Resources
  • About Us
[an error occurred while processing this directive]

Markets have navigated a more complex macro backdrop than investors anticipated at the start of 2026. Growth has remained resilient, but inflation concerns have resurfaced as higher energy prices, tariff effects, and ongoing investment in AI-related infrastructure have led investors to rethink the likely path of monetary policy. Treasury yields have risen across much of the yield curve,1 credit spreads2 have widened modestly from tight levels, and bouts of volatility have reappeared across both rates and risk assets.3 Despite this repricing, credit markets have held up well, supported by solid fundamentals, steady income demand, and healthy corporate balance sheets. We used these periods of volatility to selectively add credit risk and have since taken gains as spreads retraced.

Higher rates have created some near-term mark-to-market pressure, but they’ve also made fixed income more attractive on a forward-looking basis. Much of the shift to a higher rate environment now appears reflected in market pricing, reducing the likelihood of a sharp, unexpected adjustment. Yields in high-quality duration4 and diversified credit increasingly stand out vs. cash, offering improved carry5 and total return potential. And when compared with equities—where valuations remain elevated and earnings expectations leave less room for disappointment—higher-yielding credit continues to offer appealing risk-adjusted return potential. Just as important, today’s starting yields provide a stronger cushion against volatility than investors had in the years following the Great Financial Crisis.


Dispersion Is Creating a More Selective Credit Market

An improved entry point in fixed income doesn’t mean broad credit beta6 should be added indiscriminately. While all-in yields7 are more attractive, spreads across many higher-quality and liquid sectors remain tight by historical standards. At the same time, markets are showing greater differentiation across regions, sectors, ratings cohorts, and individual issuers. That shift points to a more selective backdrop: Fundamentals are generally solid, but higher financing costs, policy uncertainty, and energy volatility are beginning to separate winners from losers.

Higher financing costs, policy uncertainty, and energy volatility are beginning to separate winners from losers.

At the sector level, this dispersion is becoming more evident across public credit markets. Areas with stronger structural protections and shorter spread duration continue to compare favorably with segments where valuations are rich or fundamentals are more exposed to higher rates. This dynamic is becoming increasingly important as refinancing needs build and the cost of capital remains elevated. We expect this environment to reward managers that can separate attractive income opportunities from credits that are simply offering high yields because risk is deteriorating.

This backdrop reinforces the importance of active rotation and security selection across sectors:

  • Global High Yield – We currently favor US high yield, where security selection opportunities are improving, particularly in software issuers affected by AI-related concerns and in building materials companies. The outlook for European high yield is less favorable given a weaker macro backdrop.
  • Emerging Markets (EM) – Select high-yielding EM corporates, especially in telecom and utilities, continue to stand out vs. developed-market peers. However, with more compelling opportunities elsewhere, we favor selectively scaling back EM corporate exposure and remain cautious on investment-grade EM sovereigns.
  • Securitized Credit – Within securitized markets, we favor US non‑agency residential mortgage‑backed securities over credit risk transfer securities,8 supported by strong underwriting and attractive relative value. We also see value in select trophy‑office commercial mortgage‑backed securities (high‑quality properties) and recommend trimming collateralized loan obligation exposure.
  • Bank Loans – As spreads have widened and issuer-level differences have become more pronounced, loans are presenting more targeted opportunities. We see scope to add exposure, particularly in software and technology names tied to AI-related uncertainty.
  • Convertibles – Convertibles in technology and biotech remain attractive, offering a compelling mix of potential equity upside and downside support. However, valuations are less attractive than earlier this year, so selective trimming may be warranted.

Our predictive indicators continue to point to a balanced approach to overall credit risk. Higher yields support maintaining meaningful exposure to fixed income, while tight spreads and a more uncertain macro backdrop caution against becoming overly aggressive. The most attractive opportunities are likely to come from thoughtful sector allocation, an up-in-quality bias where compensation for risk is limited, and the flexibility to add risk as volatility creates more favorable entry points. Portfolio construction, in this context, can be just as important as broad asset-class direction.

Even in a healthy backdrop, not all credit opportunities are created equal.

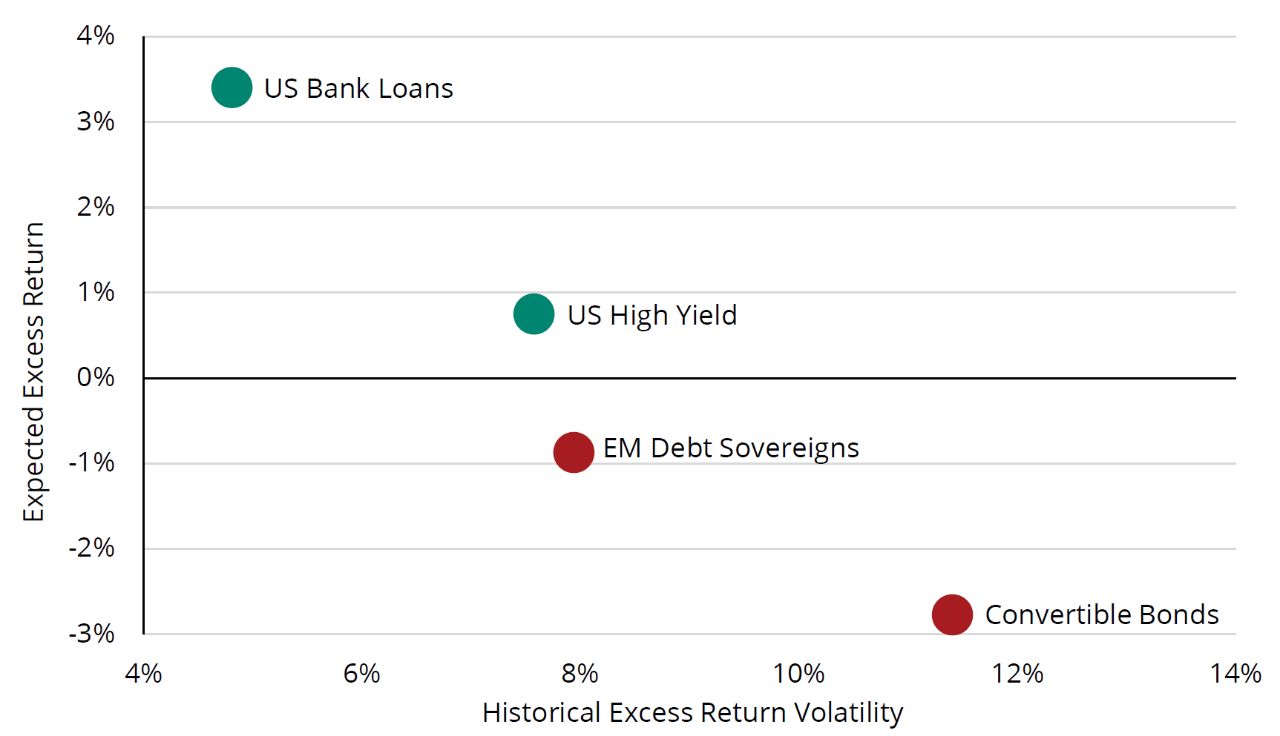
FIGURE 1 shows how forward-looking excess-return forecasts vary across sectors under a healthy economic backdrop, highlighting the differences beneath the surface of the broader fixed-income market.

FIGURE 1

Supportive Conditions Still Reward Selectivity
Bull Scenario: Excess Return vs. Historical Volatility Forecast

As of 5/31/26. Past performance does not guarantee future results. Indices are unmanaged and not available for direct investment. Excess index return forecasts are measured vs. duration-equivalent US Treasuries. The bull scenario assumes spreads remain largely unchanged. These forward-looking excess-return and volatility expectations are based on historical return and volatility analyses and are considered alongside other fundamental and technical factors to assess fixed income sector attractiveness at a given time. Please see below for representative indices. For illustrative purposes only. Sources: Bloomberg, BofA Merrill Lynch, Morningstar/LSTA, JPMorgan, Wellington Management, 6/26.

Volatility Could Continue to Create Opportunities

Volatility is likely to remain a defining feature of markets in the second half of 2026. Shifting expectations around Federal Reserve policy, geopolitical uncertainty, energy-market disruptions, and the financing demands tied to AI infrastructure all have the potential to drive sharp, albeit potentially brief, dislocations. While these episodes can be uncomfortable, they may also present more attractive entry points in sectors where fundamentals remain intact. Maintaining liquidity, along with a disciplined framework for adding risk, should allow for a timely response when markets overreact.

The key message for investors isn’t that the credit cycle has materially deteriorated, but that the margin for error has narrowed from earlier in the cycle. Higher yields have restored income to fixed-income portfolios and improved long-term return potential, but sector and issuer selection are likely to play a larger role moving forward. Through active sector rotation, disciplined timing around credit risk additions, and close collaboration across research and trading teams, we believe portfolios are well positioned to take advantage of dispersion while preserving flexibility for future volatility.


OVERALL
(as of 6/30/2026)
Overall, 5 stars, and 3-Year, 5 stars, rated against 347 and 347 products, respectively. Morningstar RatingTM is calculated for products with at least a 3-year history, based on a risk-adjusted return measure (excluding any applicable sale charges) and accounts for variations in a product's monthly performance. 5 stars are assigned to the top 10%; 4 stars to the next 22.5%, 3 stars to the next 35%, 2 stars to the next 22.5% and 1 star to the bottom 10%. ETFs and mutual funds are considered a single population. The Overall Rating is derived from a weighted average of the performance figures associated with its 3-, 5-, and 10-year (if applicable) Morningstar Rating metrics. For more information about these ratings, including their methodology, please go to global.morningstar.com/managerdisclosures . Ratings for other share classes may vary and are subject to change monthly. Past performance is no guarantee of future performance.
©2026 Morningstar, Inc. All rights reserved. The information contained herein: (1) is proprietary to Morningstar and/ or its content providers; (2) may not be copied or distributed; and (3) is not warranted to be accurate, complete or timely. Neither Morningstar nor its content providers are responsible for any damages or losses arising from any use of this information.

347 Products | Multisector Bond Category
Based on Risk-Adjusted Returns
OVERALL
(as of 6/30/2026)
Overall, 4 stars, 3-Year, 5 stars, 5-Year, 3 stars, and 10-Year, 4 stars, rated against 347, 347, 311 and 228 products, respectively. Morningstar RatingTM is calculated for products with at least a 3-year history, based on a risk-adjusted return measure (excluding any applicable sale charges) and accounts for variations in a product's monthly performance. 5 stars are assigned to the top 10%; 4 stars to the next 22.5%, 3 stars to the next 35%, 2 stars to the next 22.5% and 1 star to the bottom 10%. ETFs and mutual funds are considered a single population. The Overall Rating is derived from a weighted average of the performance figures associated with its 3-, 5-, and 10-year (if applicable) Morningstar Rating metrics. For more information about these ratings, including their methodology, please go to global.morningstar.com/managerdisclosures . Ratings for other share classes may vary and are subject to change monthly. Past performance is no guarantee of future performance.
©2026 Morningstar, Inc. All rights reserved. The information contained herein: (1) is proprietary to Morningstar and/ or its content providers; (2) may not be copied or distributed; and (3) is not warranted to be accurate, complete or timely. Neither Morningstar nor its content providers are responsible for any damages or losses arising from any use of this information.

347 Products | Multisector Bond Category
Based on Risk-Adjusted Returns

ETFs are not mutual funds. Unlike traditional open-ended mutual funds, ETF shares are bought and sold in the secondary market through a stockbroker. ETFs trade on major stock exchanges and their prices will fluctuate throughout the day. Both ETFs and mutual funds are subject to risk and volatility.

To learn more about today’s opportunities in fixed income, talk to your financial professional.


1 The yield curve is a line that plots interest rates of bonds having equal credit quality but differing maturity dates; its slope is used to forecast the state of the economy and interest-rate changes.

2 Spreads are the difference in yields between two fixed-income securities with the same maturity but originating from different investment sectors.

3 Risk assets refer to assets that have a significant degree of price volatility, such as equities, commodities, high-yield bonds, real estate, and currencies.

4 Duration is a measure of the sensitivity of an investment’s price to nominal interest-rate movement.

5 Carry is the difference between the yield on a longer-maturity bond and the cost of borrowing.

6 Beta is a measure of risk that indicates the price sensitivity of a security or a portfolio relative to a specified market index.

7 All‑in yield refers to the total yield available on a bond, reflecting both base interest rates as well as the additional income investors earn from taking on credit exposure.

8 Credit risk transfer securities (CRTs) are bonds that allow mortgage lenders to pass some of the risk of borrower defaults on to private investors in exchange for higher potential yields.

Representative Indices from Figure 1:

Convertible Bonds are represented by the Bloomberg US Bond Only Convertibles Index, which measures the performance of US convertible bonds, which offer the income characteristics of bonds with the potential to participate in stock market gains.

EM Debt Sovereigns are represented by the JP Morgan EMBI Global Diversified IG Index, which measures the performance of US dollar-denominated investment-grade bonds issued by emerging-market governments and government-related entities.

US Bank Loans are represented by the JP Morgan Leveraged Loan Index, which measures the performance of leveraged loans, which are loans made to below-investment-grade companies and typically offer floating interest rates.

US High Yield is represented by the Bloomberg US High Yield Index, which tracks the performance of US corporate bonds rated below investment grade, offering a broad measure of the high-yield, or “junk bond,” market.

Important Risks: Investing involves risk, including the possible loss of principal. Security prices fluctuate in value depending on general market and economic conditions and the prospects of individual companies. • Fixed income security risks include credit, liquidity, call, duration, event and interest-rate risk. As interest rates rise, bond prices generally fall. • Investments in high-yield (“junk”) bonds are considered speculative, involve heightened credit risk and greater risk of price volatility, illiquidity, and default than investment grade bonds. • Foreign investments, including foreign government debt, may be more volatile and less liquid than U.S. investments and are subject to the risk of currency fluctuations and adverse political, economic and regulatory developments. These risks may be greater, and include additional risks, for investments in emerging markets. • Derivatives are generally more volatile and sensitive to changes in market or economic conditions than other securities; their risks include currency, leverage, liquidity, index, pricing, valuation, and counterparty risk. • The risks associated with mortgage-related and asset-backed securities as well as collateralized loan obligations (CLOs) include credit, interest-rate, prepayment, liquidity, default and extension risk. • The purchase of securities in the To-Be-Announced (TBA) market can result in higher portfolio turnover, which could increase transaction costs and an investor’s tax liability. The risks associated with the TBA market include price and counterparty risk. • Restricted securities may be more difficult to sell and price than other securities. • Loans can be difficult to value and less liquid than other types of debt instruments; they are also subject to nonpayment, collateral, bankruptcy, default, extension, prepayment and insolvency risks. • Obligations of U.S. Government agencies are supported by varying degrees of credit but are generally not backed by the full faith and credit of the U.S. Government. • The portfolio managers may allocate a portion of the Fund’s assets to specialist portfolio managers, which may not work as intended.

Additional risks for Hartford Strategic Income ETF: The market price of the Fund’s shares will fluctuate in response to changes in the Fund’s net asset value, intraday value of the Fund’s holdings, and the supply and demand for shares on the exchange. • The Fund is actively managed and does not seek to replicate the performance of a specified index. • The Fund may effect creations and redemptions partly or wholly for cash, rather than in-kind, which may make the Fund less tax-efficient and incur more fees than an ETF that primarily or wholly effects creations and redemptions in-kind. • The Fund may have high portfolio turnover, which could increase its transaction costs and an investor’s tax liability.

Diversification does not ensure a profit or protect against a loss in declining market

The views expressed herein are those of Wellington Management, are for informational purposes only, and are subject to change based on prevailing market, economic, and other conditions. The views expressed may not reflect the opinions of Hartford Funds or any other sub-adviser to our funds. They should not be construed as research or investment advice nor should they be considered an offer or solicitation to buy or sell any security. This information is current at the time of writing and may not be reproduced or distributed in whole or in part, for any purpose, without the express written consent of Wellington Management or Hartford Funds.



WP895 5742279 HFA003669
From sub-adviser Wellington Management
Author Headshot
Hartford Strategic Income Fund Portfolio Manager
Author Headshot
Hartford Strategic Income Fund Portfolio Manager
[an error occurred while processing this directive]

The material on this site is for informational and educational purposes only. The material should not be considered tax or legal advice and is not to be relied on as a forecast. The material is also not a recommendation or advice regarding any particular security, strategy or product. Hartford Funds does not represent that any products or strategies discussed are appropriate for any particular investor so investors should seek their own professional advice before investing. Hartford Funds does not serve as a fiduciary. Content is current as of the publication date or date indicated, and may be superseded by subsequent market and economic conditions.

Investing involves risk, including the possible loss of principal. Investors should carefully consider a fund's investment objectives, risks, charges and expenses. This and other important information is contained in the mutual fund, or ETF summary prospectus and/or prospectus, which can be obtained from a financial professional and should be read carefully before investing.

Mutual funds are distributed by Hartford Funds Distributors, LLC (HFD), Member FINRA|SIPC. ETFs are distributed by ALPS Distributors, Inc. (ALPS). Advisory services may be provided by Hartford Funds Management Company, LLC (HFMC) or its wholly owned subsidiary, Lattice Strategies LLC (Lattice). Certain funds are sub-advised by Wellington Management Company LLP and/or Schroder Investment Management North America Inc (SIMNA). Schroder Investment Management North America Ltd. (SIMNA Ltd) serves as a secondary sub-adviser to certain funds. HFMC, Lattice, Wellington Management, SIMNA, and SIMNA Ltd. are all SEC registered investment advisers. The funds and other products referred to on this Site may be offered and sold only to persons in the United States and its territories.

Hartford Funds refers to HFD, Lattice, and HFMC, which are currently not affiliated with any sub-adviser or ALPS.

On June 3, 2026, The Hartford Insurance Group, Inc. (“The Hartford”) and Wellington announced that they had reached a definitive agreement under which Wellington Investment Advisors Holdings, LLP, Wellington’s corporate parent, will acquire Hartford Funds. Upon closing Hartford Funds will be integrated into Wellington’s U.S. Wealth business. The deal is expected to close in the first quarter of 2027, subject to regulatory and fund approvals. Upon closing, Hartford Funds would become an affiliate of Wellington. For more information, click here.

© Copyright 2026 Hartford Funds Management Group, Inc. All Rights Reserved. Not FDIC Insured | No Bank Guarantee | May Lose Value 

[an error occurred while processing this directive]